Node.js in a Kubernetes world
7 basic tasks Node.js developers need to understand about Kubernetes

Node.js in a Kubernetes world
7 basic tasks Node.js developers need to understand about Kubernetes
This post was written by Michael Dawson, OpenJS Foundation Board Member and Node.js community lead at IBM. This first appeared on IBM Developer.
Kubernetes is fast becoming the leader for deploying and managing production applications, including those written in Node.js. Kubernetes is complex, though, and learning the ins and outs of the technology can be difficult, even for a seasoned developer.
Node.js application developers may not need to manage Kubernetes deployments in our day-to-day jobs or be experts in the technology, but we must consider Kubernetes when developing applications.
As a reminder, Docker and Kubernetes are the foundation of most modern clouds, including IBM Cloud. Cloud native development refers to creating applications that you will deploy in Docker or Kubernetes, and cloud-native applications often conform to the tenants of a 12 Factor application.

In this article, I try to answer the question: “As a Node.js devleoper, what do I need to know about Kubernetes?” I cover a number of key tasks you must complete when building your Node.js application in a cloud-native manner, including:
- Building Docker images
- Deploying containerized applications
- Testing your applications
- Health checking
- Logging
- Gathering metrics
- Upgrading and maintaining containerized applications
Building Docker images
Deploying to Docker or Kubernetes requires that you build a Docker image. To do that, you typically start with an existing image and layer in the additional components that you need.
When building Node.js applications, the community provides a number of official Docker images that you can start with. These images add the Node.js binaries to an existing Linux distribution (Debian or Alpine) and offer a way to bundle your application into the image so that it runs when you start the Docker container.
Each time the project publishes a new release, it creates new Docker images. For example, when 12.13.1 was released, the new Docker image “node:12.13.1” was made available.
There are three variants of the Node.js images:
- Debian-based images with the core components needed to build and test Node.js applications.
- Slim images which are Debian-based images with only the minimal packages needed to run a Node.js application after it is already built.
- Alpine-based images for those who need the smallest container size.
There are a number of tags that you can use to specify the image you want. See Docker Hub for the full list.
When choosing your base image, keep in mind:
- Alpine binaries are not built as part of the main Node.js releases. This means that they are built from source and there is more risk of regressions.
- You should likely use both the standard Debian image along with the Slim image in a multistage build in order to achieve a smaller resulting image size. More on that in the next section
Build your image
Once you’ve chosen your base image, the next step is to actually build the image which bundles in your application. This is done through a Dockerfile. The simplest Dockerfile is as follows:
FROM node : 12.13.1
EXPOSE 3000
COPY server.js .
CMD node server.js
This Dockerfile simply copies your application code (server.js) into the official image with the node:12.13.1 binaries and indicates that server.js should be run when the image is started. Note that you did not have to install Node.js as it is already installed and in the default path as part of the node:12.13.1 base image.
To build an image from this file, put the file into a directory with your application code and then from that directory run docker build . -t test1:new. This builds a docker image named test1, and with the new tag, based on the contents of the current directory.
While this sounds straightforward, Dockerfiles can quickly become complicated because you want to build the image in a way that only includes the minimum components needed to run your application. This should exclude intermediate artifacts, for example the individual object files created when native addons are compiled. To exclude intermediate artifacts, a multistage build is commonly used where artifacts are generated in one step or image and then copied out to another image in a later stage. Read more about this in the Docker documentation.
Once you have built the image, you need to push it to a registry and then you can run and test your application under Docker or Kubernetes. It’s best to test in as close an environment to the production deployment as possible. Today, that often means Kubernetes.
Deploying your application to Kubernetes
In order to deploy and test your image in Kubernetes you use one or more deployment artifacts. At the lowest level, much of the Kubernetes configuration is through YAML. To deploy and access your application through a port, you need three YAML files.
To start, you need a deployment which specifies which image to use (the one you pushed to the registry earlier). For example:
apiVersion: apps/v1
kind: Deployment
metadata:
    name: test1
    labels:
        app: test1
spec:
    replicas: 2
    selector:
        matchLabels:
            app: test1
    template:
        metadata:
            labels:
                app: test1
        spec:
            containers:
            - name: test1
               image: test1:new
               imagePullPolicy: Never
               args:
In this case, it’s specifying through the image: entry that it should use the Docker image named test1 with the new tag (which matches what we built in the earlier step). You would use the following command to deploy to Kubernetes: kubectl apply -f deployment.yaml.
Similarly, you’d need to deploy a service to provide a way to get to the running containers that make up the deployment and an ingress to allow external access to that service:
kubectl apply -f service.yaml

kubectl apply -f ingress.yaml
I won’t go into the details here, but the key is that you need to understand and write YAML along with understanding the YAML for deployments, services, and ingress.
If this sounds a bit cumbersome, it is, and you are not the first one to think so. Helm charts were developed to bring together a deployment, service, and ingress in a way to simplify deployments.
The basic structure of a Helm chart is as follows:
Package-name/
  charts/
  templates/
  chart.yaml
  LICENSE
  README.md
  Requirements.yaml
  Values.yaml
The base Helm chart has templates which you can configure to avoid having to write your own deployment, service, and ingress YAML files. If you have not already written those files, it is probably easier to use that configuration option. You can, however, just copy your files into the template directory and then deploy the application with helm install dirname, where dirname is the name of the directory in which the chart files are located.
Helm is billed as the “Package Mana ger for Helm” and does make it easier to deploy an application configured through multiple YAML files and possibly multiple components. There are, however, shortcomings, including concerns over security and relying on only static configuration versus being able to have programmatic control. Operators look to address these issues. Read more about them here: https://github.com/operator-framework.
Iterative testing
After you figure out how to deploy your application, you need to test your application. The development and test process is iterative, so you probably need to rebuild, deploy, test a number of times. Check out our article on test-driven development.
If you are testing in Docker, you need to build a new image, start a container, and then access the image during each iteration. If you are testing in Kubernetes, you have to delete pods, redeploy, and so forth. Even when using Helm charts, this will take a number of commands and time for things to spin up. The key challenge is that this all takes time and that can slow down your development process.
So far, we’ve talked about building and testing an image for your application, but not what’s in your application itself. I can’t talk about your specific application, but let’s look at what you should build into your application in order to support a cloud-native deployment.
Health checking your applications
The first thing you need to build into your application is support for liveness and readiness endpoints. Kubernetes has built-in functionality to check these endpoints:
- Liveness – restart the container when the liveness endpoint does not respond indicating the application is alive.
- Readiness – defer sending traffic until application is ready to accept traffic, or step sending traffic if application is no longer able to accept traffic.
Kubernetes supports three probe types.
- Running a command (through shell in the container)
- HTTP probe
- TCP probe
As a Node.js developer, you will probably use an HTTP probe. A response code of >=200 and less than 400 means everything is okay.
You configure the probes through the deployment YAML. For example:
apiVersion: v1
kind: Pod
metadata:
     name: test1
     labels:
          apps: test1
spec:
    containers:
     - name: test1
        image: test1:latest
        imagePullPolicy: Never
        args:
        - /server
        livenessProbe:
          httpGet:
             path: /live
             port: 3000
           initialDelaySeconds: 5
           periodSeconds: 10
        readinessProbe:
           httpGet:
              path: /live
              port: 3000
            initialDelaySeconds: 1
            periodSeconds: 10
In this code listings, I added a liveness prob on port 3000 using the /live path.
Additionally:
- initialDelaySeconds controls how quickly to start checking (in order to allow enough time for the application to start up).
- periodSeconds controls how often to check.
- timeoutSeconds is 1 by default, so if your probe can take longer than that you’ll have to set that value as well.
- failureThreshold controls how many times the probe needs to fail before the container will restart. You want to ensure that you don’t get into a loop where the application continues to restart and never has long enough to become ready to serve the probes.
Similarly, I added a readinessProbe on port 3000 using the /ready path. To test this out, I created an application that only responds successfully to the readinessProbe after 10 seconds. If I query the pods after deploying the application the output is:
User10minikube1:~/test$ kubectl get all
NAME           READY       STATUS        RESTARTS        AGE
pod/test1      0/1         Running       0               6s
Which shows 0/1 under READY indicating that the application is not yet ready to accept traffic. After 10 seconds, it should show 1/1, and Kubernetes will start routing traffic to the pod. This is particularly important when we scale up or down as we don’t want to route traffic to a new container until it is ready or else it will slow responses even though another container is up and already capable of responding quickly.
The readiness and liveness probes may be as simple as:
app.get('/readiness', (req, res) => {

  res.status(200).send();

});

app.get('/liveness', (req, res) => {

  res.status(200).send();

});
However, you will often need to check the liveness and readiness of other components within your application. This can get complicated if you have a lot of subcomponents. If you have a lot of subcomponents to check, I recommend using a package like CloudNativeJS/cloud-health that allows you to register additional checks.
Logging
Node.js developers also need to know how to do logging in a cloud-native environment. In container development, writing logs out to disk does not generally make sense because of the extra steps needed to make the logs available outside the container—and they will be lost once the container is stopped.
Logging to standard out (stdout) is the Cloud native way, and structured logging (for example using JSON) is the current trend. One of my current favorite modules is pino which is a fast, structured logger and is easy to use.
Kubernetes has support for watching standard out, so it’s easy to get the log output, for example you can use kubectl logs -f <name of pod> where <name of pod> is the name of a specific pod as follows:
user1@minikube1:~/test$ kubectl get pods
NAME                     READY   STATUS    RESTARTS   AGE
test1-7bbc4449b4-98w2j   1/1     Running   0          30s
test1-7bbc4449b4-zqx6f   1/1     Running   0          30s
user1@minikube1:~/test$ kubectl logs -f test1-7bbc4449b4-98w2j
{"level":30,"time":1584451728646,"pid":1,"hostname":"test1-7bbc4449b4-98w2j","msg":"/live","v":1}
{"level":30,"time":1584451734486,"pid":1,"hostname":"test1-7bbc4449b4-98w2j","msg":"ready","v":1}
{"level":30,"time":1584451738647,"pid":1,"hostname":"test1-7bbc4449b4-98w2j","msg":"/live","v":1}
{"level":30,"time":1584451748643,"pid":1,"hostname":"test1-7bbc4449b4-98w2j","msg":"/live","v":1}
{"level":30,"time":1584451758647,"pid":1,"hostname":"test1-7bbc4449b4-98w2j","msg":"/live","v":1}
{"level":30,"time":1584451768643,"pid":1,"hostname":"test1-7bbc4449b4-98w2j","msg":"/live","v":1}
{"level":50,"time":1584451768647,"pid":1,"hostname":"test1-7bbc4449b4-98w2j","msg":"down","v":1}
{"level":30,"time":1584451778648,"pid":1,"hostname":"test1-7bbc4449b4-98w2j","msg":"/live","v":1}
{"level":30,"time":1584451788643,"pid":1,"hostname":"test1-7bbc4449b4-98w2j","msg":"/live","v":1}
Cloud deployment environments like the IBM Cloud also have more sophisticated options for collecting and aggregating logs across containers, including LogDNA or the elastic stack Elasticsearch, Logstash, and Kibana.
Gathering metrics
In a Kubernetes deployment your application is running in containers, there may be multiple copies of each container, and it is not necessarily easy to find or access those containers in order to gather information about how your application is running. For this reason, it is important to export the key metrics from your container that you need to understand and track the health of your application.
Prometheus is the defacto standard on this front. It defines a set of metrics that you should export and gives you the ability to add additional application-specific metrics that are important to your business.
As an example, the following shows an example of the metrics returned using one of the available Prometheus packages:
# HELP process_cpu_user_seconds_total Total user CPU time spent in seconds.
# TYPE process_cpu_user_seconds_total counter
process_cpu_user_seconds_total 1.7980069999999984 1585160007722

# HELP process_cpu_system_seconds_total Total system CPU time spent in seconds.
# TYPE process_cpu_system_seconds_total counter
process_cpu_system_seconds_total 0.931571000000001 1585160007722

# HELP process_cpu_seconds_total Total user and system CPU time spent in seconds.
# TYPE process_cpu_seconds_total counter
process_cpu_seconds_total 2.7295780000000067 1585160007722

# HELP process_start_time_seconds Start time of the process since unix epoch in seconds.
# TYPE process_start_time_seconds gauge
process_start_time_seconds 1584451714

# HELP process_resident_memory_bytes Resident memory size in bytes.
# TYPE process_resident_memory_bytes gauge
process_resident_memory_bytes 17645568 1585160007723

# HELP process_virtual_memory_bytes Virtual memory size in bytes.
# TYPE process_virtual_memory_bytes gauge
process_virtual_memory_bytes 881635328 1585160007723

# HELP process_heap_bytes Process heap size in bytes.
# TYPE process_heap_bytes gauge
process_heap_bytes 90226688 1585160007723

# HELP process_open_fds Number of open file descriptors.
# TYPE process_open_fds gauge
process_open_fds 20 1585160007723

# HELP process_max_fds Maximum number of open file descriptors.
# TYPE process_max_fds gauge
process_max_fds 201354

# HELP nodejs_eventloop_lag_seconds Lag of event loop in seconds.
# TYPE nodejs_eventloop_lag_seconds gauge
nodejs_eventloop_lag_seconds 0.000200848 1585160007723

# HELP nodejs_active_handles Number of active libuv handles grouped by handle type. Every handle type is C++ class name.
# TYPE nodejs_active_handles gauge
nodejs_active_handles{type="Socket"} 2 1585160007722
nodejs_active_handles{type="Server"} 1 1585160007722

# HELP nodejs_active_handles_total Total number of active handles.
# TYPE nodejs_active_handles_total gauge
nodejs_active_handles_total 3 1585160007722

# HELP nodejs_active_requests Number of active libuv requests grouped by request type. Every request type is C++ class name.
# TYPE nodejs_active_requests gauge
nodejs_active_requests{type="FSReqCallback"} 2

# HELP nodejs_active_requests_total Total number of active requests.
# TYPE nodejs_active_requests_total gauge
nodejs_active_requests_total 2 1585160007722

# HELP nodejs_heap_size_total_bytes Process heap size from node.js in bytes.
# TYPE nodejs_heap_size_total_bytes gauge
nodejs_heap_size_total_bytes 5971968 1585160007723

# HELP nodejs_heap_size_used_bytes Process heap size used from node.js in bytes.
# TYPE nodejs_heap_size_used_bytes gauge
nodejs_heap_size_used_bytes 4394216 1585160007723

# HELP nodejs_external_memory_bytes Nodejs external memory size in bytes.
# TYPE nodejs_external_memory_bytes gauge
nodejs_external_memory_bytes 3036410 1585160007723

# HELP nodejs_heap_space_size_total_bytes Process heap space size total from node.js in bytes.
# TYPE nodejs_heap_space_size_total_bytes gauge
nodejs_heap_space_size_total_bytes{space="read_only"} 262144 1585160007723
nodejs_heap_space_size_total_bytes{space="new"} 1048576 1585160007723
nodejs_heap_space_size_total_bytes{space="old"} 3256320 1585160007723
nodejs_heap_space_size_total_bytes{space="code"} 425984 1585160007723
nodejs_heap_space_size_total_bytes{space="map"} 528384 1585160007723
nodejs_heap_space_size_total_bytes{space="large_object"} 401408 1585160007723
nodejs_heap_space_size_total_bytes{space="code_large_object"} 49152 1585160007723
nodejs_heap_space_size_total_bytes{space="new_large_object"} 0 1585160007723

# HELP nodejs_heap_space_size_used_bytes Process heap space size used from node.js in bytes.
# TYPE nodejs_heap_space_size_used_bytes gauge
nodejs_heap_space_size_used_bytes{space="read_only"} 32296 1585160007723
nodejs_heap_space_size_used_bytes{space="new"} 419112 1585160007723
nodejs_heap_space_size_used_bytes{space="old"} 2852360 1585160007723
nodejs_heap_space_size_used_bytes{space="code"} 386368 1585160007723
nodejs_heap_space_size_used_bytes{space="map"} 308800 1585160007723
nodejs_heap_space_size_used_bytes{space="large_object"} 393272 1585160007723
nodejs_heap_space_size_used_bytes{space="code_large_object"} 3552 1585160007723
nodejs_heap_space_size_used_bytes{space="new_large_object"} 0 1585160007723

# HELP nodejs_heap_space_size_available_bytes Process heap space size available from node.js in bytes.
# TYPE nodejs_heap_space_size_available_bytes gauge
nodejs_heap_space_size_available_bytes{space="read_only"} 229576 1585160007723
nodejs_heap_space_size_available_bytes{space="new"} 628376 1585160007723
nodejs_heap_space_size_available_bytes{space="old"} 319880 1585160007723
nodejs_heap_space_size_available_bytes{space="code"} 3104 1585160007723
nodejs_heap_space_size_available_bytes{space="map"} 217168 1585160007723
nodejs_heap_space_size_available_bytes{space="large_object"} 0 1585160007723
nodejs_heap_space_size_available_bytes{space="code_large_object"} 0 1585160007723
nodejs_heap_space_size_available_bytes{space="new_large_object"} 1047488 1585160007723

# HELP nodejs_version_info Node.js version info.
# TYPE nodejs_version_info gauge
nodejs_version_info{version="v12.13.1",major="12",minor="13",patch="1"} 1
There are Node.js packages that can help you export the recommended set of metrics and the ones you need that are specific to your application. prom-client is my current favorite for integrating Prometheus metrics into a Node.js application.
Kubernetes also generates Prometheus metrics, and Kubernetes distributions or cloud platforms often make it easy to scrape your requested endpoints, aggregate them, and then graph the resulting data. Even if you install Kubernetes locally, there are Helm charts that make it easy to do this. The end result is that if you export Prometheus metrics from your application it will generally be quite easy for you or your operations teams to aggregate, chart, and alert on this data.
Maintaining and upgrading your applications
As with all application development, you have to think about maintaining and upgrading your application. Kubernetes helps you update your application deployment by rolling out updated containers, but it does not help you update the contents of the containers you built.
You have to have a plan for how to maintain and upgrade each component you use to build your container or that you add into your container. These range from docker images, Dockerfiles, live and readiness endpoints, logging, and metrics.
If you have X projects with Y containers, you can end up with a big number of container images that you must maintain. When you decide to update a dependency (for example the logger or Prometheus package etc.), you have to figure out which images need to be updated, what versions they are already using, and the like.
What happens if you move to a new team? You’ll need to figure out what their docker file look like, how the deployment artifacts are organized, what endpoint names are used for liveness and readiness, which logger they are using, and more just to get started.
I don’t know about you, but at this point I start to think “enough is enough” — I just want to focus on the application code —. Do I really need to think about Docker, Dockerfiles, YAML and all this stuff that’s outside of my application itself?
Separating concerns
What I’d really like is some separation of concerns and tooling to help me build/test efficiently using best practices agreed on by my organization. Something along these lines:
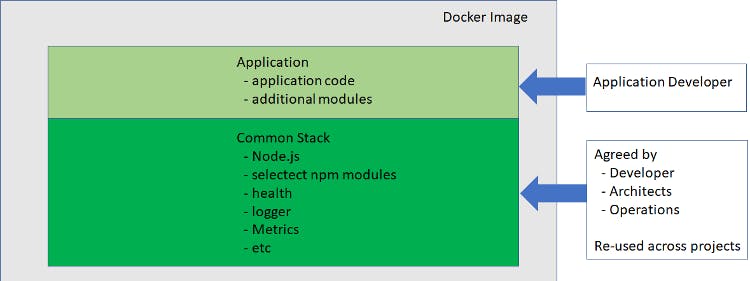
The two main components are:
- a common stack agreed on by developers, architects, and operations which is re-used across projects within my organization
- the application and additional packages that I need for the applications that I’m working on
For me, having consistency in the areas that don’t affect the “secret sauce” for the application I’m working on brings great benefits in ongoing maintenance and upgrades and even moving across teams. I look at this as Consistency where it makes sense as opposed to uniformity.
Tools to help with consistency
There are a few tools that can help isolate the tasks that you don’t need to worry about so that you can just focus on your code. I’ll introduce three new ones that I think can help you succeed.
Appsody
The Appsody open source project attempts to separate the operations aspects of application development to allow developers to focus on their application code, while at the same time building on a common Stack(s) that can be shared across an organization.
Appsody helps in the following ways:
- Builds a base stack that you can layer applications on top of. This include most of the base components I’ve mentioned above which are needed for cloud-native deployment.
- Accelerates the iterative local development and test cycle.
- Simplifies creating Docker images using best practices and deploying them to Kubernetes.
There are Node.js-specific stacks in Appsody, including
- nodejs – base stack for any Node.js application
- nodejs-express – base stack with express built in
- nodejs-loopback – base stack with loopback built in
- nodejs-functions – base stack where you can write functions in the Function as a service(FaaS) style
I’m excited about Appsody offering reusable stacks that can be shared across teams, and that allows architects and operators to update the stack separately from the application itself. This is a newish approach (hence, the incubator in the path for the stacks), so I won’t be surprised if there are tweaks to the approach or tools as people experiment and get more familiar with it.
It’s great to see an open source code base starting to form and allow organizations to start proving out the approach. The existing stacks integrate liveness, readiness endpoints, and export a Prometheus endpoint. At the same time, the base Appsody framework also provides commands for building and deploying containers to Kubernetes or testing locally in Docker. The result is that much of what you need to know or understand as a Node.js developer for a coud-native deployment is supported by the tooling.
While I still think it is good for you to have a basic understanding of Kubernetes and cloud-native development, these new tools ensure you won’t need to be an expert on the ins and outs of the deployment YAML files, multistage Docker files, and the like.
Codewind
If you like what you see in Appsody but prefer a graphical user interface, you might want to check out the open source Codewind project. It adds a nice GUI, has Appsody integration, and allows you to bring your own visual editor (for example VS Code). It also adds in performance monitoring and Tekton pipelines. I’m more of a command line vi person, but if you’re interested you can check out it out here.
IBM Cloud Pack for Applications
Finally, if you are sold on this approach and want to build on a supported stack from IBM, check out the IBM Cloud Pack for Applications which includes the stack- based approach as well as support for Node.js.
Final thoughts
I hope you’ve gained a more concrete understanding of what cloud-native development and Kubernetes means to you as a Node.js developer and hope I’ve piqued your interest in stack-based development and Appsody. I talked on this subject at the most recent Node+JS Interactive conference and if you’d like to watch the recording, check out the slides and watch the recording.