Tutorial: Use The Weather Company’s APIs to build a Node-RED weather dashboard
This blog post was written by John Walicki, CTO for Edge/IoT Advocacy in the Developer Ecosystem Group of IBM Cognitive Applications Group and originally published on IBM Developer.
Tutorial: Use The Weather Company’s APIs to build a Node-RED weather dashboard
Build a hyper-local weather dashboard
This blog post was written by John Walicki, CTO for Edge/IoT Advocacy in the Developer Ecosystem Group of IBM Cognitive Applications Group and originally published on IBM Developer.
Learn how to build a weather dashboard using a personal weather station, Node-RED, Weather Underground, and The Weather Company APIs and the node-red-contrib-twc-weather nodes. This tutorial demonstrates how to display hyper-local weather information from a residential or farming weather station.
Learning objectives
In this tutorial, you will:
- Learn the basics of personal weather stations (PWS)
- Connect your PWS to Weather Underground (WU) and view PWS data on WU
- Register for a The Weather Company (TWC) API key
- Get started with the TWC API documentation
- Learn about Node-RED (local and on IBM Cloud)
- Explore the node-red-contrib-twc-weather Node-RED PWS node examples
- Import / Deploy the Weather Dashboard example
- Display PWS data in your Weather Dashboard
- Build a Severe Weather Alert Map Node-RED Dashboard using TWC APIs
- Build a Call for Code Water Sustainability solution
Prerequisites
- Node-RED installed locally or Create a Node-RED Starter application in the IBM Cloud
- Once Node-RED is installed, add the dependencies:
npm install node-red-contrib-twc-weather node-red-dashboard node-red-node-ui-table node-red-contrib-web-worldmap
- Send your PWS data to http://www.wunderground.com and retrieve your PWS API key
- If you don’t have a PWS, you can still get a time-restricted TWC API key by joining Call for Code (which gives you access to most of the TWC PWS APIs)
Estimated time
Completing this tutorial should take about 30 minutes.
Steps
Introduction to personal weather stations
Wikipedia defines a personal weather station as a set of weather measuring instruments operated by a private individual, club, association, or business (where obtaining and distributing weather data is not a part of the entity’s business operation). Personal weather stations have become more advanced and can include many different sensors to measure weather conditions. These sensors can vary between models but most measure wind speed, wind direction, outdoor and indoor temperatures, outdoor and indoor humidity, barometric pressure, rainfall, and UV or solar radiation. Other available sensors can measure soil moisture, soil temperature, and leaf wetness.
The cost of a sufficiently-accurate personal weather station is less than $200 USD; they have become affordable for citizen scientists and weather buffs.
Connect your PWS to Weather Underground
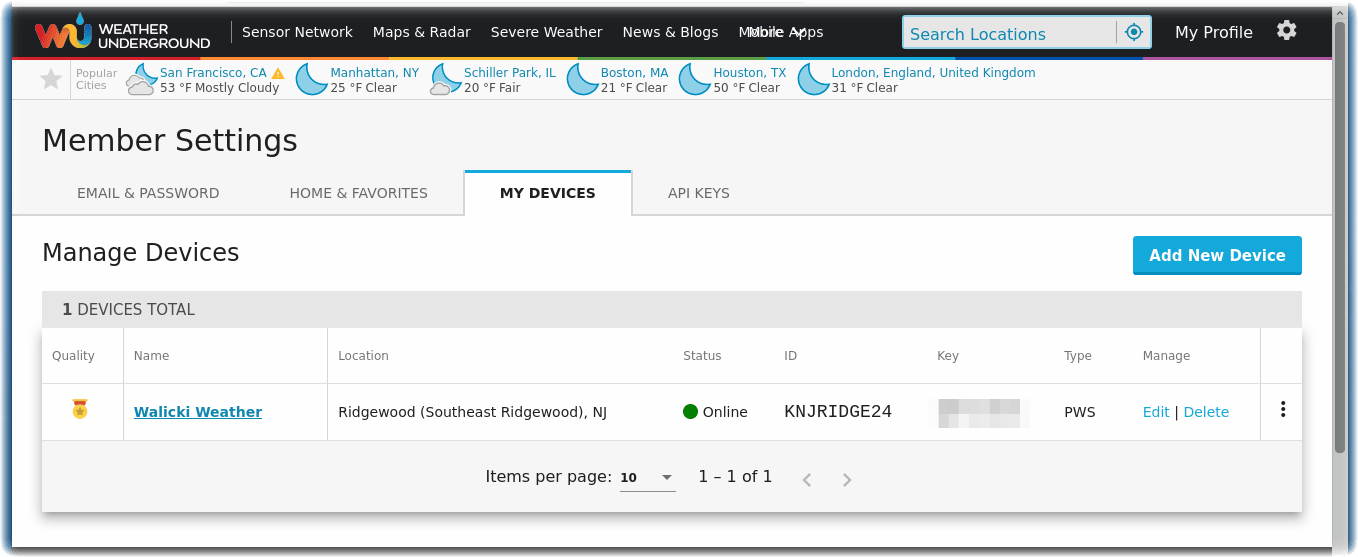
Many PWS brands offer the ability to connect and send weather data to cloud based services. Weather Underground, a part of The Weather Company, an IBM Business, encourages members to register their PWS and send data to http://www.wunderground.com.
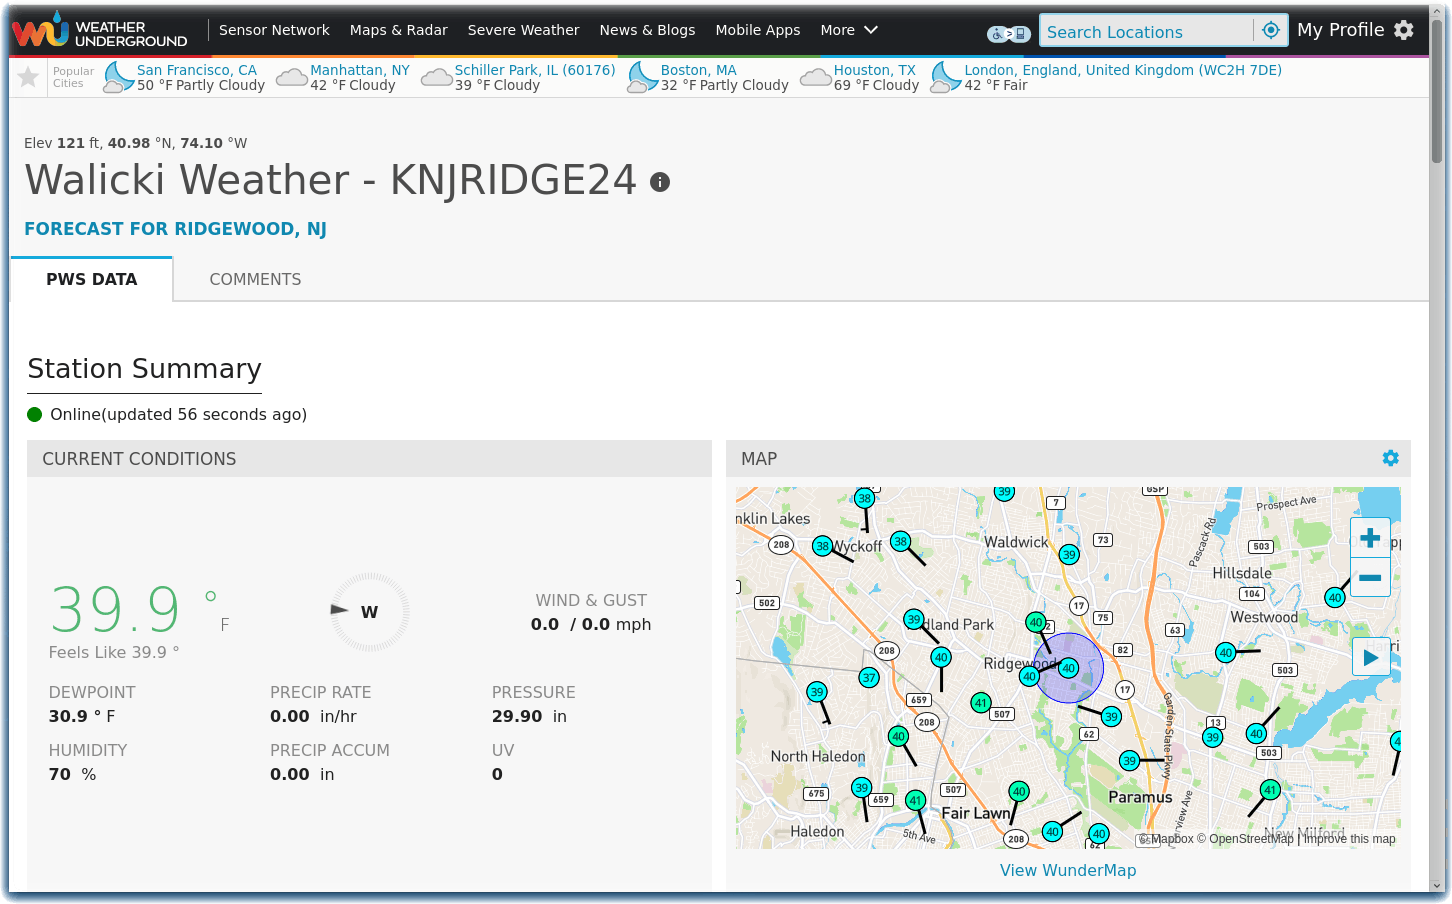
Members can view their personal weather station data on Weather Underground
Get a TWC API key and get started with the TWC API documentation
In addition to the wunderground.com dashboard, the PWS data is available through your API Key and a set of robust TWC Restful APIs. Copy your API Key and click on the View API Documentation button.
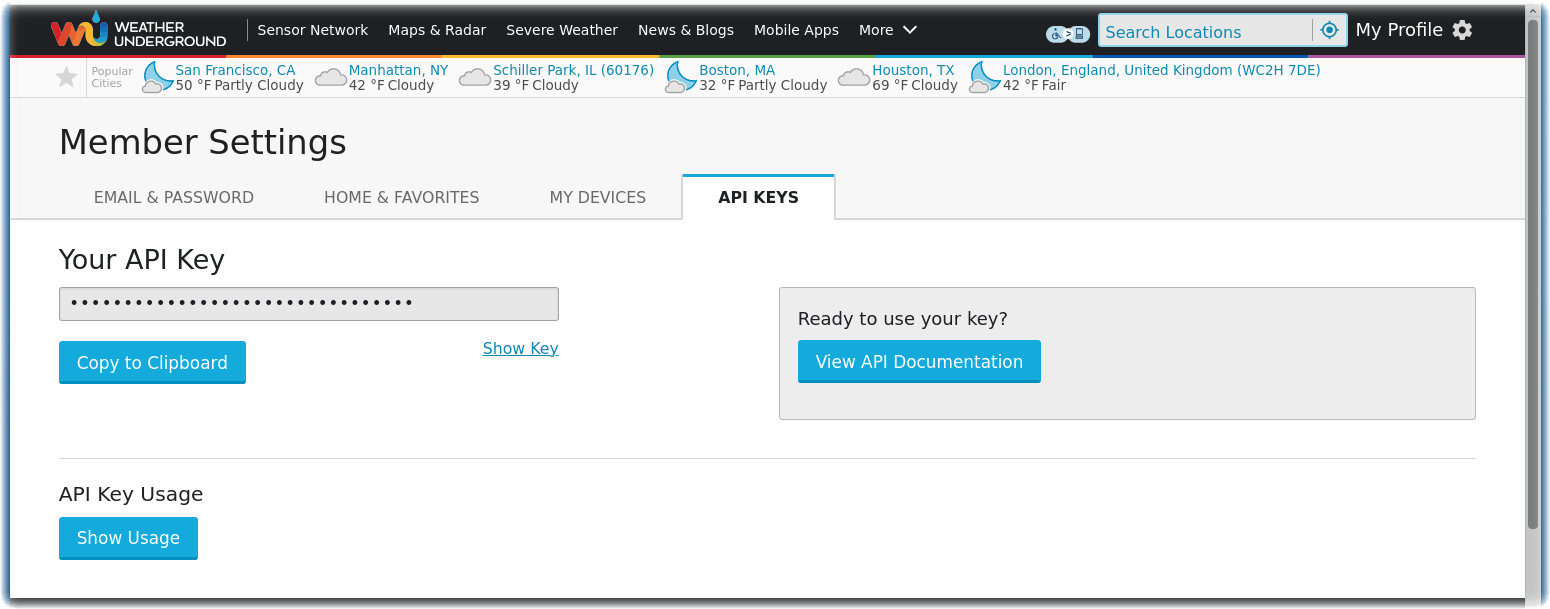
Register for a TWC API key
If you don’t have a Personal Weather Station, you can still register for a time-restricted TWC API key by joining Call for Code 2020. The API Key is valid from March 1 to October 15, 2020. This API key gives you access to most of the TWC Personal Weather Station APIs. You can complete this tutorial using this API key.
Learn about Node-RED
Node-RED is an open source programming tool for wiring together hardware devices, APIs, and online services in new and interesting ways. It provides a browser-based editor that makes it easy to wire together flows using the wide range of nodes in the palette that can be deployed to its runtime in a single-click.
Follow these instructions to install Node-RED locally or Create a Node-RED Starter application in the IBM Cloud
Install node-red-contrib-twc-weather nodes
Once Node-RED is installed, add the dependencies for this tutorial:
npm install node-red-contrib-twc-weather node-red-dashboard node-red-node-ui-table node-red-contrib-web-worldmap
Explore node-red-contrib-twc-weather Node-RED PWS node examples
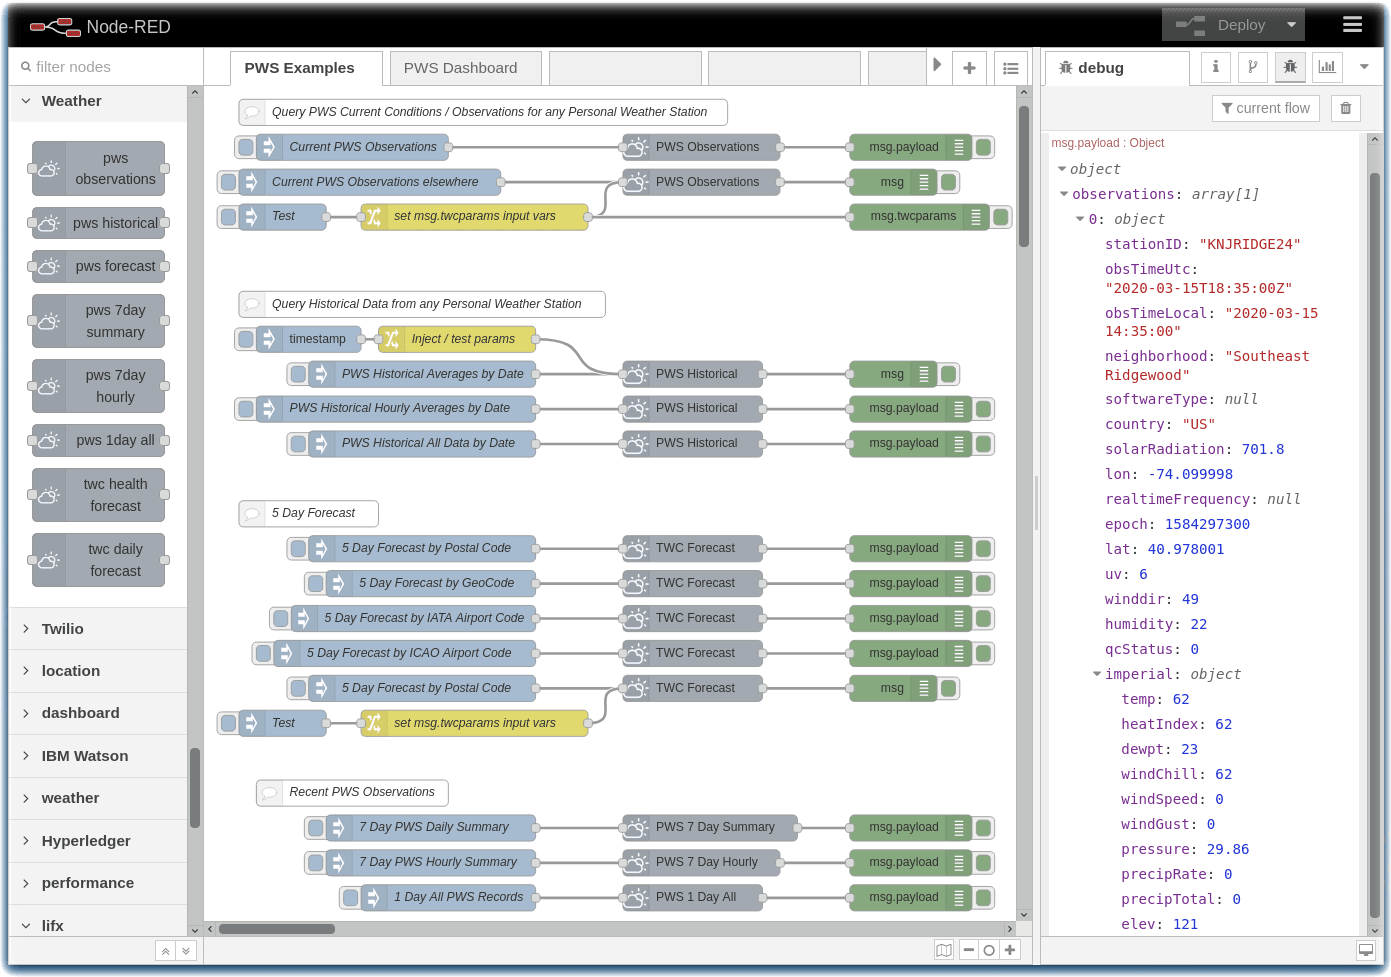
The node-red-contrib-twc-weather GitHub repository includes an example flow that exercises each of the Node-RED PWS APIs. You can learn about the nodes and their configuration options by clicking on each node and reading its comprehensive node information tab. Import this PWS-Examples.json flow into your Node-RED Editor and Deploy the flow. Don’t forget to paste in your TWC PWS API key. If you want to explore personal weather station data but don’t have your own PWS, you can query the weather station data at the Ridgewood Fire Headquarters using the StationID KNJRIDGE9
Import / Deploy the weather dashboard example
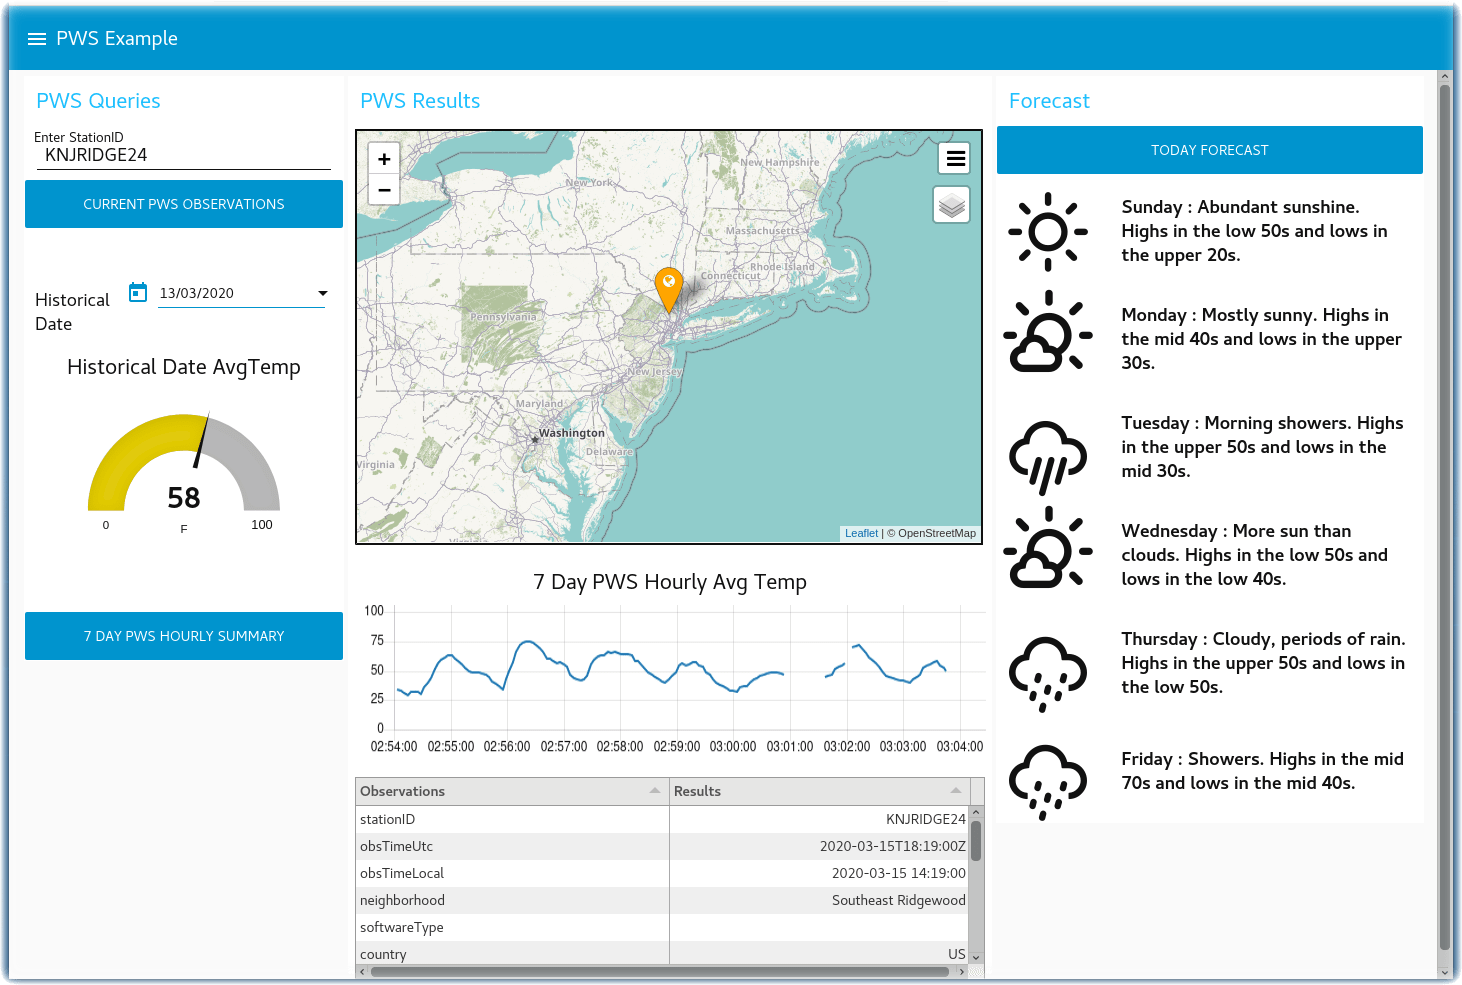
Now that the Node-RED node-red-contrib-twc-weather nodes are able to query weather data, let’s build an example Weather Node-RED Dashboard that displays Personal Weather Station current and historical data on a map, in a table, a gauge, and on a chart. The PWS API key includes access to the TWC 5 Day Forecast, which is displayed with weather-lite icons. This flow requires node-red-dashboard, node-red-node-ui-table, and node-red-contrib-web-worldmap. Import this PWS-Dashboard.json flow and Deploy the flow.
Display PWS data in your weather dashboard
Launch the Node-RED Dashboard and experiment with the current conditions, forecast, and map. The Call for Code TWC API key might not have access to private PWS historical data.
Build a Severe Weather Alert Map Node-RED Dashboard using TWC APIs
In addition to the node-red-contrib-twc-weather Node-RED nodes, you can review the TWC Severe Weather API Documentation and use the http request node and your API Key to make calls directly.
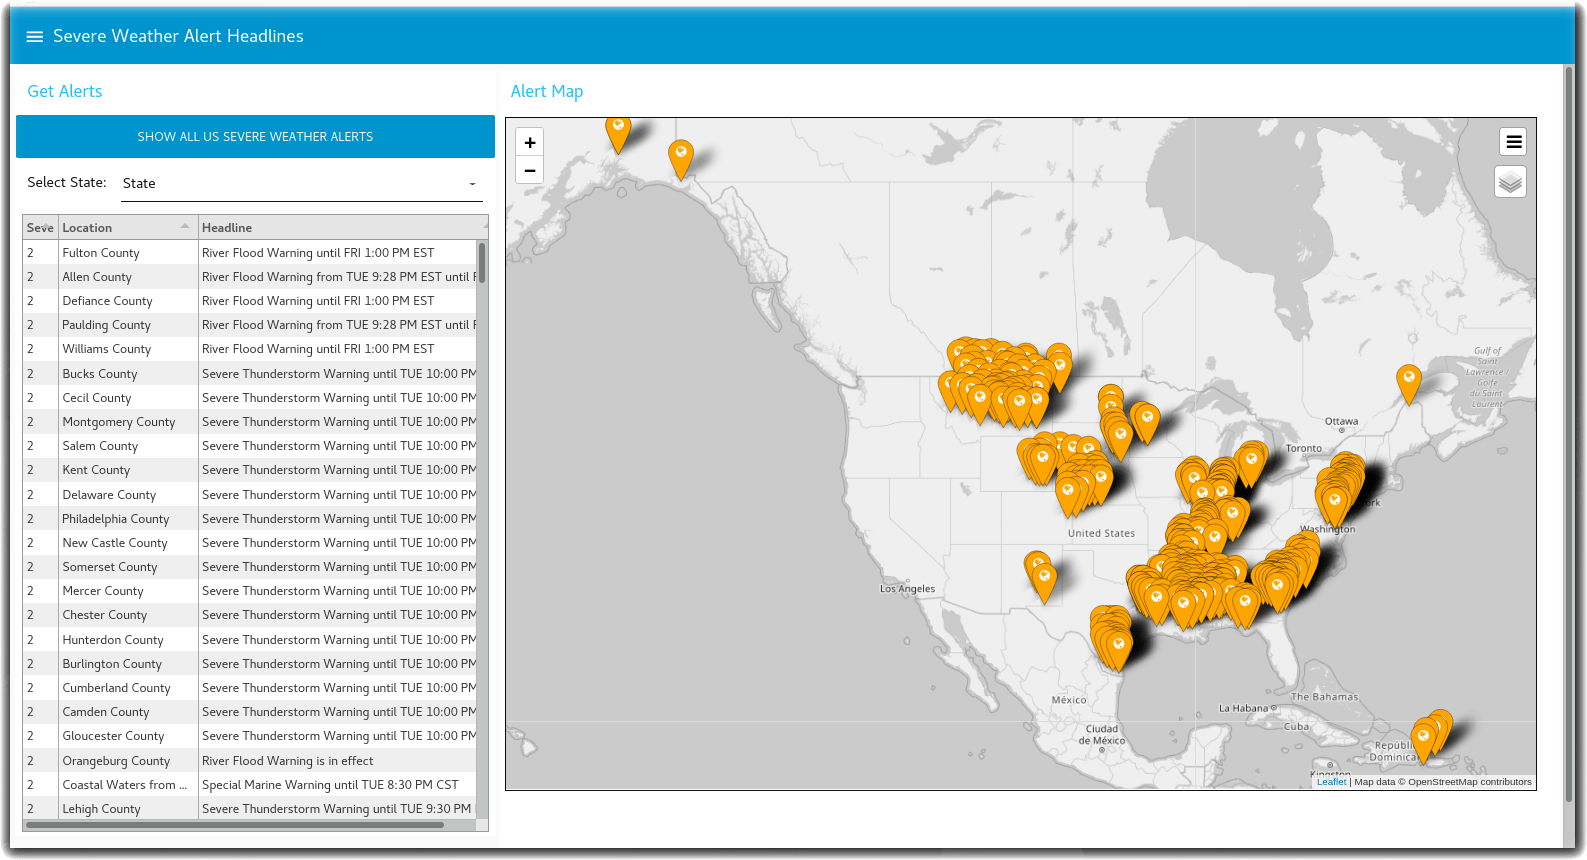
The The Weather Company APIs includes an API to query all of the current Severe Weather Alerts issued by the National Weather Service. This next example plots those Severe Weather Alerts on a Node-RED Dashboard.
This example flow and Node-RED Dashboard might be useful as part of a Call for Code solution.
Display Severe Weather Alerts on a map
Get the Code: Node-RED flow for Severe Weather Alerts
Summary
Build a Call for Code Water Sustainability solution!
Now that you have completed this tutorial, you are ready to modify these example flows and Node-RED Dashboard to build a Call for Code Water Sustainability solution.