Visualizing Success: Year One of the OpenVis Collaboration Space
It’s been one year since the inception of the Open Visualization Collaboration Space!
Visualizing Success: Year One of the OpenVis Collaboration Space
It’s been one year since the inception of the Open Visualization Collaboration Space!
“OpenVis” is a collaboration space and a forum within the OpenJS Foundation to neutrally govern kepler.gl, deck.gl, and the vis.gl suite of frameworks, a comprehensive and widely adopted set of visualization libraries based on JavaScript and WebGL.
Some of the milestones in the past year include:
kepler.gl is now used by around 30,000 weekly users (for the application version) with a wide range of industry integrations (for the library)
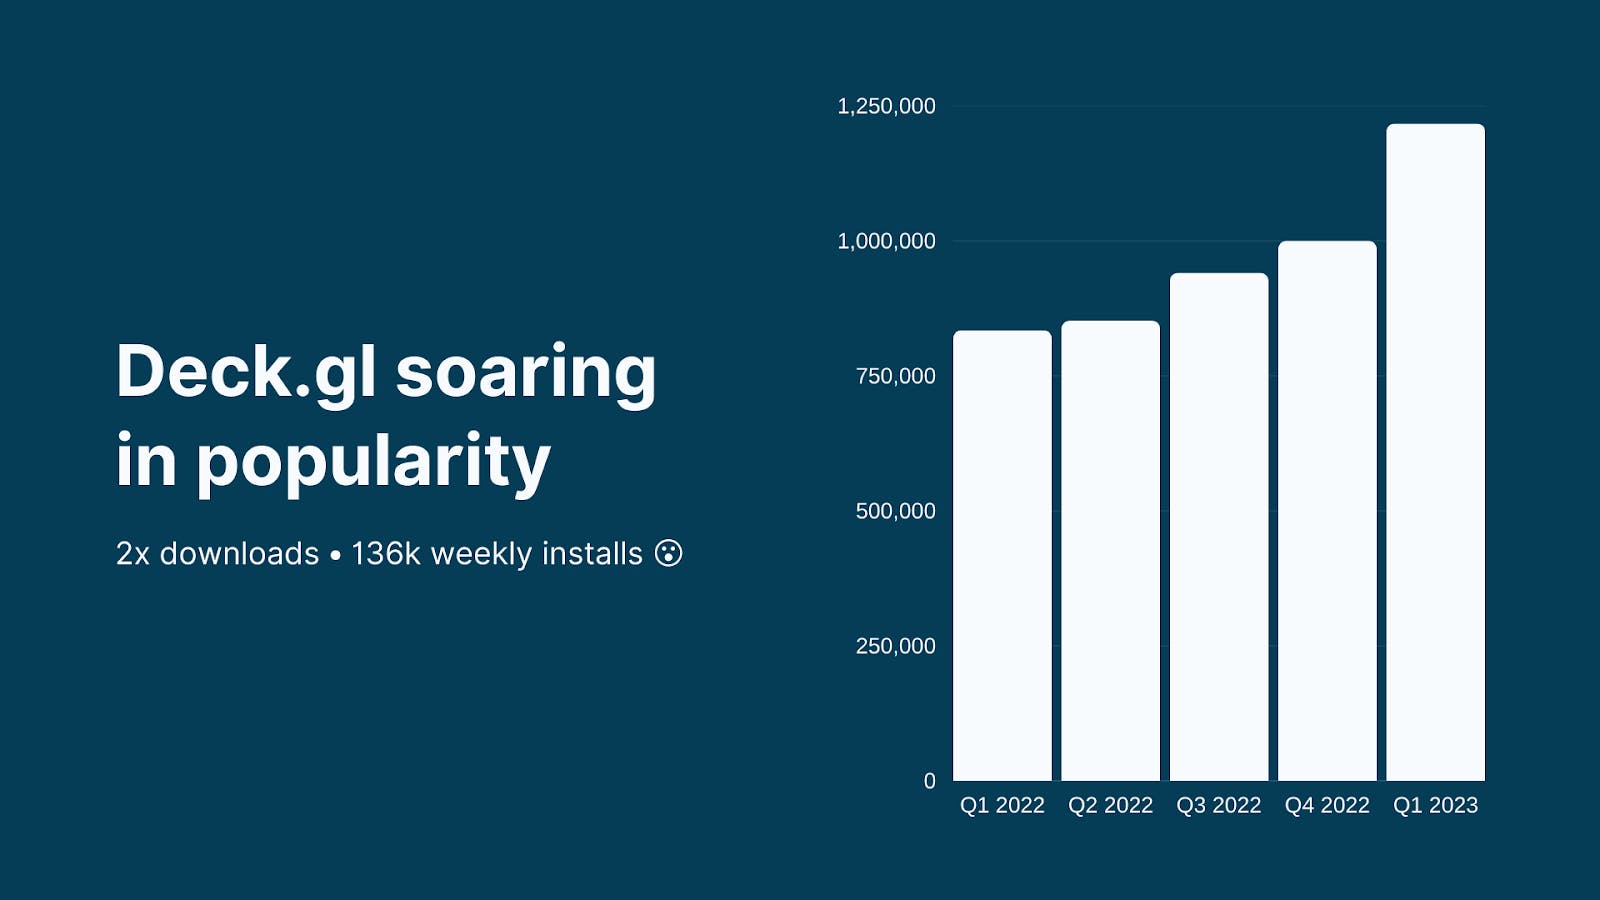
deck.gl is one of the top web-based visualization libraries and it doubled its growth to over 136,000 weekly downloads
deck.gl released 8.7, 8.8, and 8.9
loaders.gl released 3.2, 3.3, 3.4
react-map-gl released 7.0, 7.1
kepler.gl released 3.0 to alpha
New framework flowmap.gl, joined vis.gl
New home page and documentation websites
Held the Open Visualization Collaborator Summit in Madrid with over 100 contributors
A big thank you to our OpenVis team for all of their efforts this year! Read on to see the details of these milestones.
Embracing Open Governance
At OpenJS World 2022, the OpenJS Foundation partnered with the Urban Computing Foundation (UCF) to form the Open Visualization Collaboration Space. At the time, Robin Ginn, OpenJS Foundation executive director said “Improved visualization tools are key to improving JavaScript in fields like geospatial analysis, data-driven mapping, self-driving cars, and more.”
Under the OpenJS Foundation, OpenVis has flourished with open governance. Open governance not only embodies the principles of open source, but it further enhances them. While the source code is available like with traditional open source projects, open governance takes it a step further by ensuring decisions are made collectively. Contributors openly discuss, collaborate, and cooperate, driving the direction of the project in a transparent manner. In the past month, a new website was created to support the project!
Project Growth
kepler.gl and the vis.gl frameworks are all part of OpenVis. vis.gl is a suite of frameworks for GPU powered data visualization and analysis of large datasets on the web. It is one of the most widely adopted WebGL visualization libraries, with close to 100K daily downloads from npm. The offerings of vis.gl are packaged and best represented by its flagship framework, deck.gl. And kepler.gl is a data-agnostic, high-performance web-based application for visual exploration of large-scale geolocation data sets.
In the past year, OpenVis accomplished a wide range of improvements and upgrades:
- New support for Photorealistic 3D Tiles, released by Google, to render entire cities in stunning detail using the deck.gl Tile3DLayer and 3D Tile Loaders in loaders.gl
- New deck.gl layer extensions: TerrainExtension, CollisionFilterExtension, and MaskExtension
- New support for Mapbox-compatible plugins in React-Map-GL, such as mapbox-gl-draw and mapbox-gl-geocoder
- Added TypeScript to kepler.gl, deck.gl, loaders.gl, and luma.gl.
- And a lot more
By any measure, it was a fantastic first year. And we have big plans coming up!
Hitting Big Milestones
kepler.gl
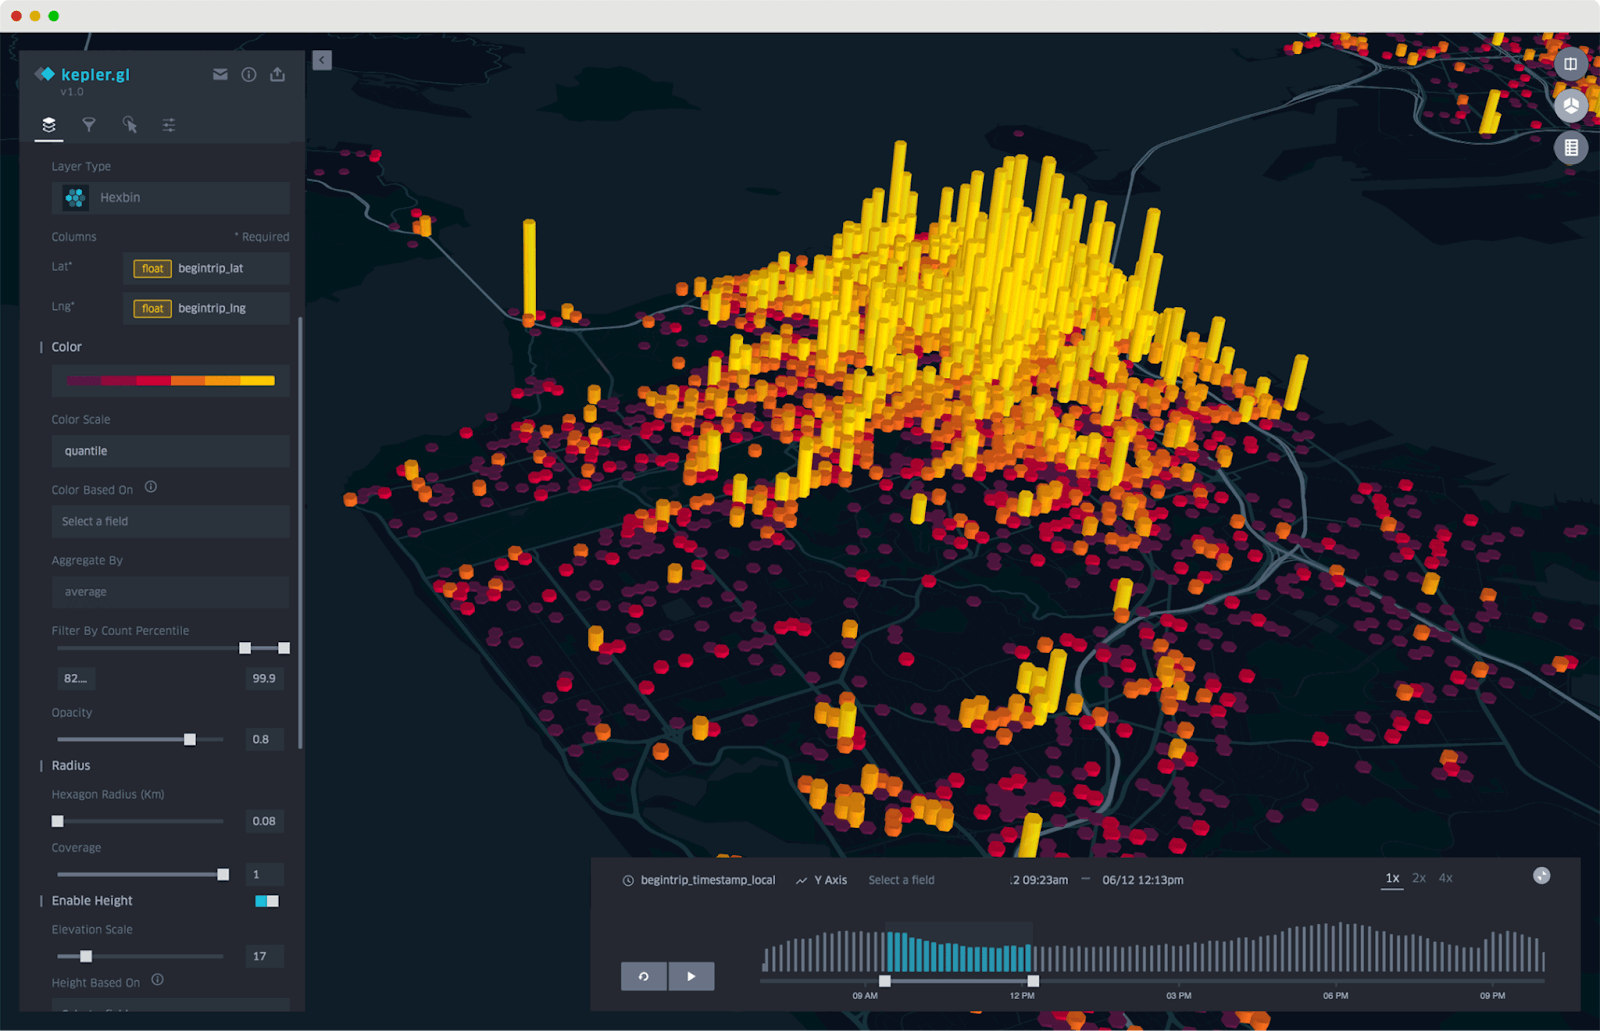
kepler.gl stands out as one of the most powerful open source browser-based tools for geospatial analysis and visualization of large data sets. Built on top of the deck.gl and vis.gl frameworks, this web-based application is designed for exploratory geospatial visualization. The beauty of kepler.gl lies in its powerful and intuitive UI, allowing both technical and non-technical users to visualize data with ease. Moreover, it’s free and requires no sign-up, making it available as both an application and a UI library.
Recognition and Use Cases
kepler.gl is well known in geospatial analytics, visualization fields and the mobility space, with approximately 30,000 weekly users. It’s been integrated with a variety of platforms, including Jupyter Notebooks, Jupyter Labs, VSCode, Tableau, and Apache Superset. Many companies in the mobility space use kepler.gl internally for geospatial analysis, demonstrating its versatility and efficiency.
Integration and Customization
Companies, including Foursquare, Uber, and CARTO, have adopted the kepler.gl UI library for creating their own customized applications. Recent updates have focused on “hardening” kepler.gl, making it more robust for production applications. These improvements encompass conversion to TypeScript, modularization, exposing more APIs, and numerous fixes. React component factories, which allow the injection of custom components into the UI and handle state changes, have been improved. A key advantage of using the kepler.gl UI library is the reduced need to fork kepler.gl, avoiding long-term maintenance challenges.
Conversion to TypeScript Reduces Complexity
By far the biggest change in kepler.gl is the conversion of the entire code base to TypeScript, involving over a person-year of work. This conversion was aimed at mitigating code base complexity. This means that:
- Developers can look up type definitions to quickly understand what the expected data formats are in various cases.
- Developers now have a strong safety net when making changes and additions to the code
Smaller Modules Helps Reduce Size
The kepler.gl code base keeps growing. To help developers, big monolithic modules were broken up into independent smaller ones published on npm. Developers can install only what they need.
React-Map-GL: Support for Alternate Basemap Libraries
The base map library in kepler.gl is available as its own React component. React-Map-GL is a user-friendly API wrapper for React. It works with Mapbox and now MapLibre. Version 7, released this year, was a complete rewrite of the library, addressing issues in versions 6 and 5. The bundle size has been reduced by 74%. Support for any Mapbox-compatible plugins like mapbox-gl-draw and mapbox-gl-geocoder, to name a few, has been added and has paved the way for adding compatibility for more map libraries.
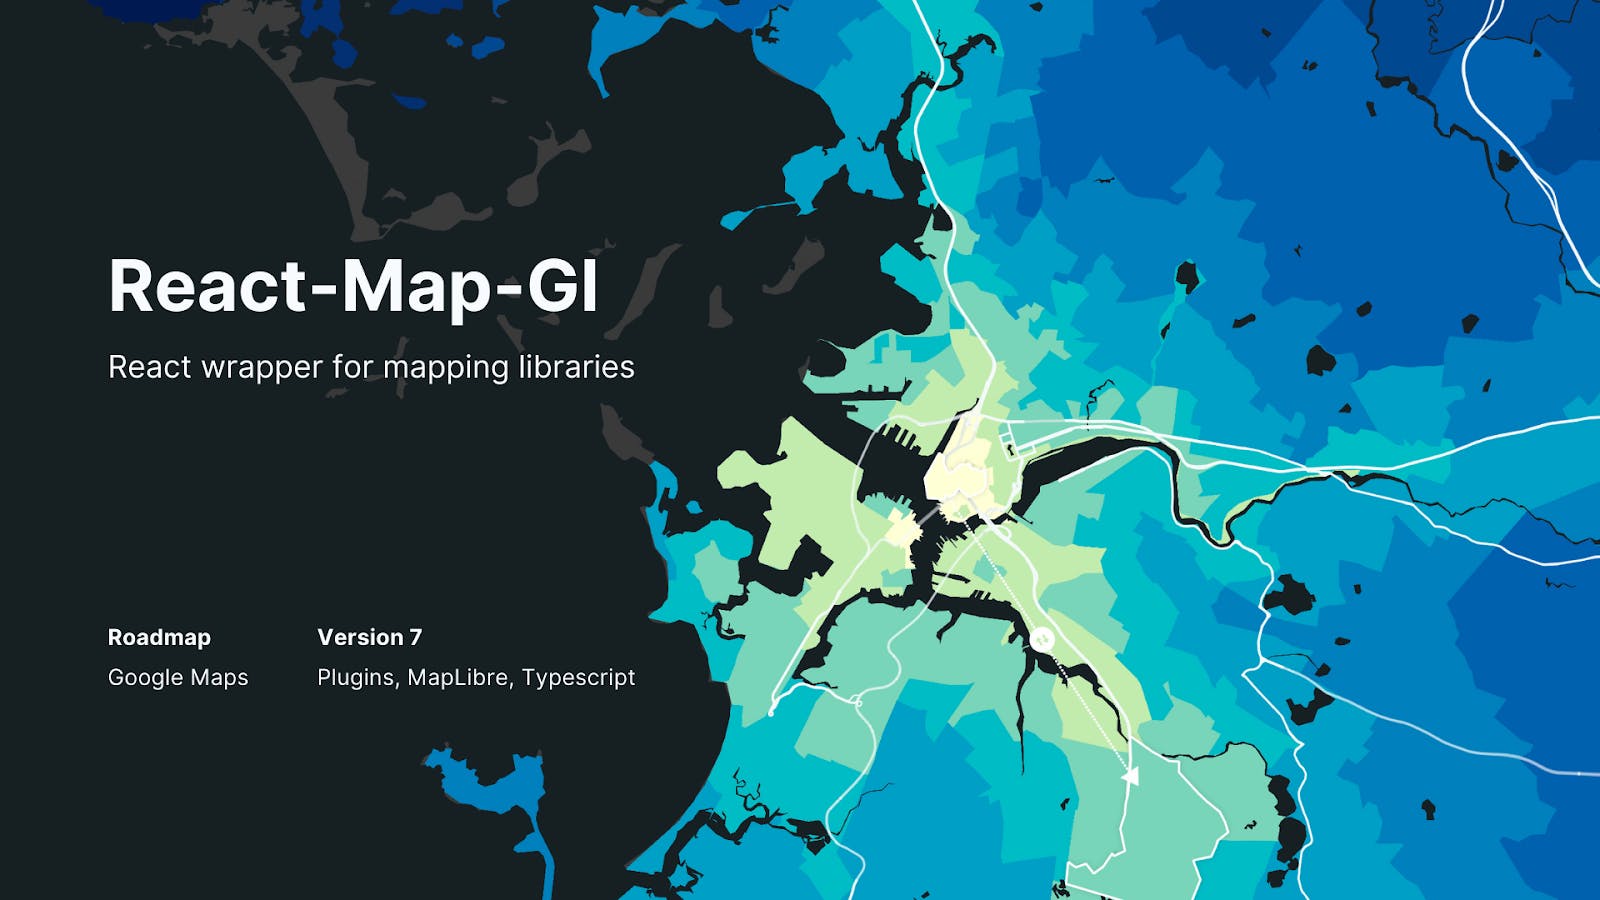
Later this year, OpenVis plans to add a Google Maps React wrapper which will function similarly to the existing wrappers.
vis.gl and deck.gl
vis.gl is a suite of JavaScript visualization frameworks. The offerings of vis.gl are packaged and best represented by its flagship framework, deck.gl.
deck.gl is one of the top web-based visualization libraries, with over 136,000 weekly downloads, doubling its growth compared to last year.
Integration and Application
deck.gl has been integrated with most popular base map providers such as Mapbox, Google Maps and ArcGIS. Its compatibility extends to bindings for React, Python/Jupyter, R, Vega and CUDA, making it a versatile tool for various applications. deck.gl also offers libraries for specific applications such as 3D geometry editing (nebula.gl), animation (hubble.gl), autonomous vehicles (AVS), multiplexed bioimaging (Viv), to name a few.
Companies including Google, ESRI, CARTO, Foursquare and Cesium have contributed to deck.gl, enhancing its capabilities to work with their libraries or data formats.
Complex Visualizations Made Simple
deck.gl is an ideal tool for exploring and visualizing large datasets. For simple projects with maps, a user might just use react-map-gl. But for more complex and customized visualizations,, deck.gl’s extensive catalog of composable layers, combined with facilities for creating custom layers take applications to the next level..
It also makes it easy to package and share those visualizations as reusable layers for other people. While the deck.gl API follows a Reactive programming paradigm, making it work seamlessly with frameworks such as React, deck.gl is a pure JavaScript framework, and works in any environment that supports WebGL.
Enhancing Development and Publishing Tools
The tools for deck.gl development and publishing have also seen significant improvements. All examples are now bootstrapped with vite, pre-building scripts have been updated to use esbuild, and the website documentation is generated with Docusaurus. All of this allows first-time users to get started more quickly, for either contributing or just using the library.
Improving Robustness with TypeScript
Like kepler.gl, deck.gl was converted to Typescript. This conversion was not aimed at making the framework more developer-friendly, but also at improving the robustness and maintainability of the code, making outside contributions more manageable.
New Layer Extensions
A focus of developers for deck.gl over the past year was Extensions. Extensions can be optionally added on to core deck.gl layers without bloating the core. They are not included in layers by default.
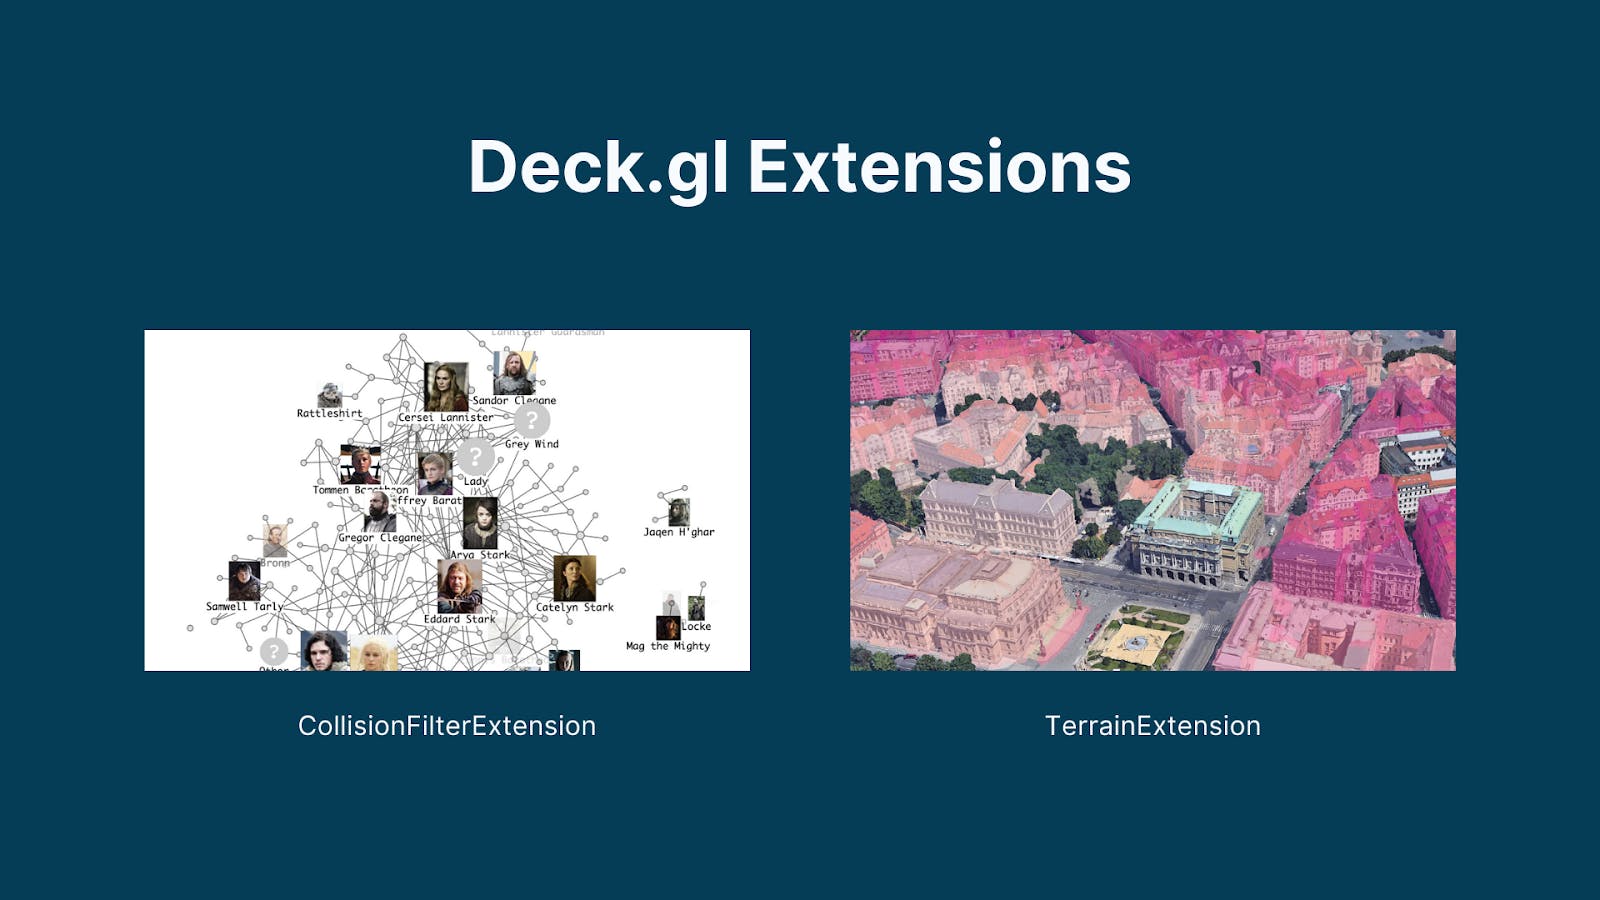
There are currently 9 Extensions available and developers can author their own layer extensions. Three new extensions were added in the last year – MaskExtension, CollisionFilterExtension, and TerrainExtension:
- MaskExtension – Allows layers to show/hide objects by a geofence. The masking is performed on the GPU
- CollisionFilterExtension – Allows layers to hide features which overlap with other features. Works with all layers within the library, like text, scatter plot, and more.
- TerrainExtension – Renders otherwise 2D data along a 3D surface. geoJSON can be overlayed on an elevation model. This is especially useful when viewing a mixture of 2D and 3D data sources. The repositioning of all the geometries is done on the GPU, so it is done dynamically in real-time and interactively. The designer of the maps does not need to focus on the complexities of offsetting the 2D and 3D maps.
Photorealistic 3D Tiles from Google Opens Up Opportunities
Photorealistic 3D Tiles was released by Google with a dataset that is comparable to Google Earth. Users can now leverage the deck.gl Tile3DLayer to render entire cities in amazing detail. Combining this with TerrainExtension allows overlaying 2D layers onto 3D cityscapes. All of this can be done at runtime with very little code. See documentation for getting started.
This opens up a huge opportunity for exploratory analysis capabilities. It’s more than just a technology advancement. Instead of unique solutions from different vendors like Google and Mapbox with their own distinct visualizations, deck.gl’s open governance model and OpenVis standards can connect these diverse solutions, and lead to a more collaborative and integrated mapping ecosystem.
Special thanks to OpenVis members at CARTO and our Technical Steering Committee for help in these areas.
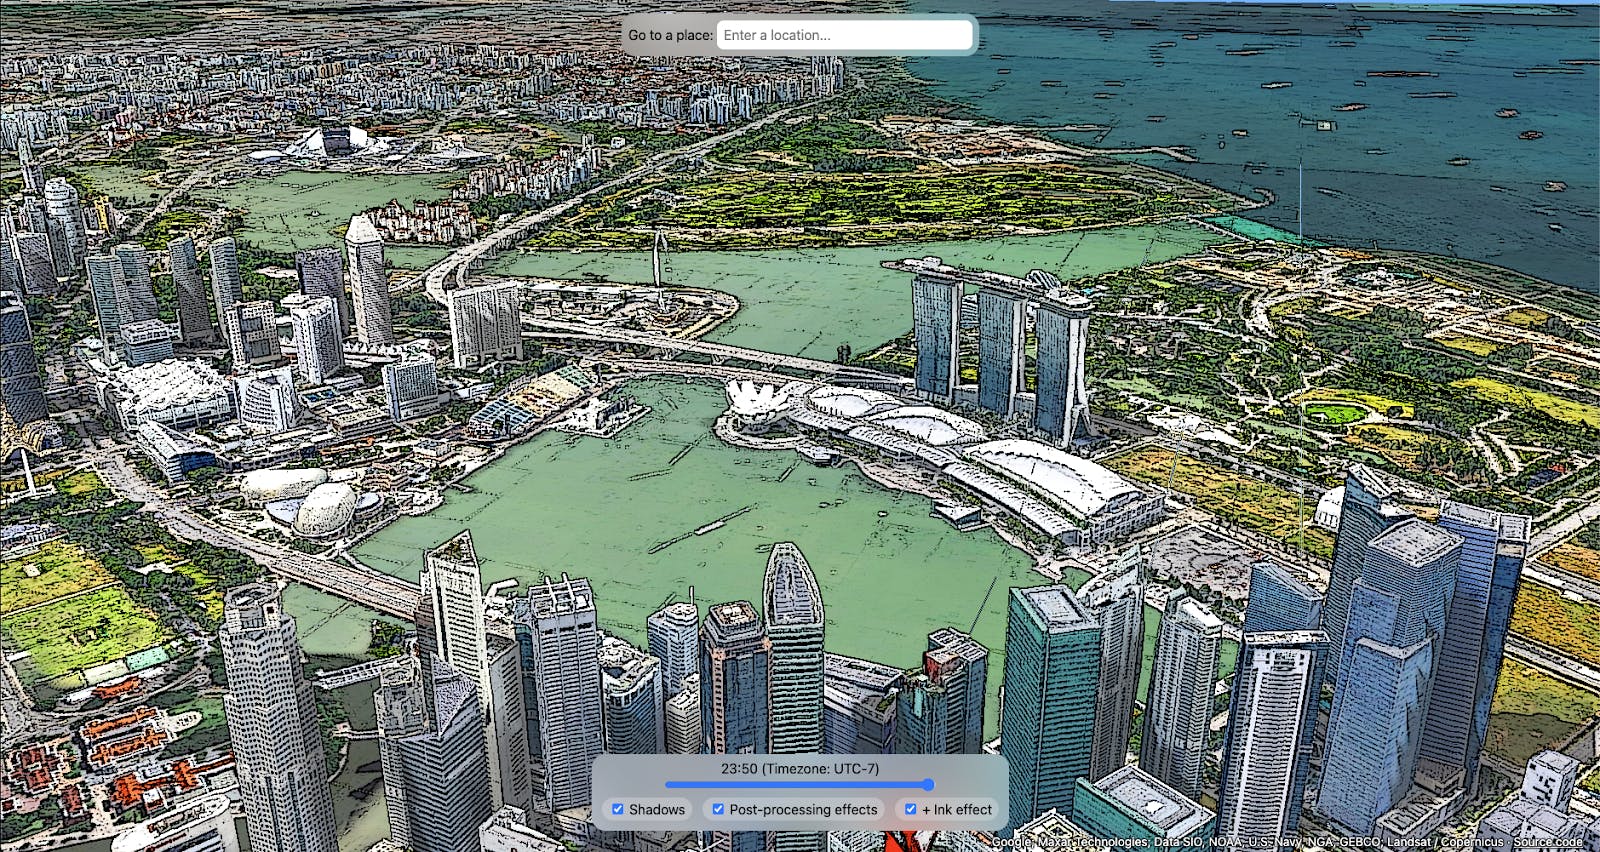
Project Highlight: Add Lighting and Effects for Stunning Results
Community member, Chee Aun Lim, demonstrated the remarkable creative potential of deck.gl in a captivating demo. By skillfully employing the built-in Effects system, Lim incorporated Sun Lighting and Shadows to lend depth to his data visualization. This was further enhanced with the application of Post Processing Effects, resulting in a polished, visually impressive representation. This project is a great example of how data visualizations can be transformed into immersive experiences. We highly recommend exploring this project on Github!
New Framework flowmap.gl Joined OpenVis
flowmap.gl is a framework for geospatial flowmaps. It is a JavaScript module which can be used for visualization of geographic movement: mobility, transportation, migration, and more. For flows like people moving around a city, or a subway system, you want to know the location but also see how data changes over time. The layer is rendered in a WebGL context and is capable of adaptive aggregation and filtering, which allows it to handle relatively large numbers of flows. Flowmap.gl is adding a variety of deck.gl layers for flow data.
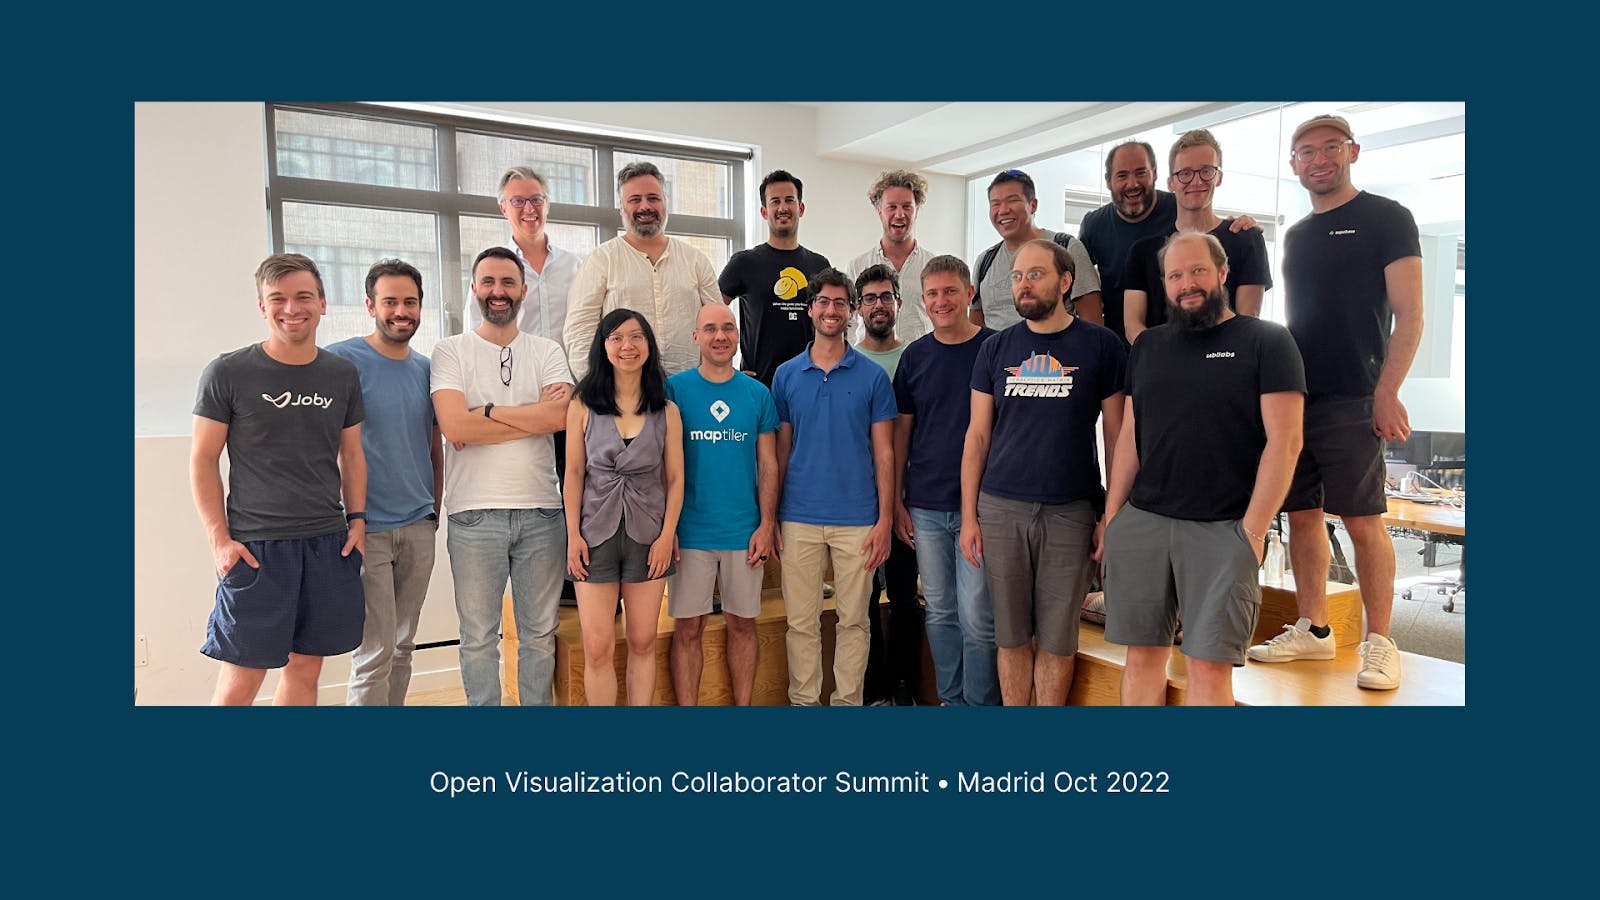
Community Growth and the Open Visualization Collaborator Summit, Madrid, Spain, Oct 2022
OpenVis recently held the first ever Open Visualization Collaborator Summit with about 100 contributors participating from a broad international open visualization community. Participating companies included CARTO, Google, Joby Aviation, Microsoft, Foursquare, Mapbox and many more.
There was a great lineup of talks and presentations. Just two key examples:
Paul Taylor, NVIDIA, on “GPU-accelerated Geospatial Analytics with NVIDIA RAPIDS,” showed how it is a lot easier to optimize data analysis and visualizations with the latest CUDA GPUs. Before, deck.gl performance was limited by web browsers, since it’s a JavaScript library. Now users can use deck.gl with the latest native desktop APIs within Node.js. This lets users render much more data much more quickly.
Kyle Barron, Foursquare, on “GeoArrow and GeoParquet in deck.gl” showed how to use GeoArrow and GeoParquet in JavaScript in the geospatial stack. He did it with deck.gl, which offers a low-level binary interface for data-intensive applications. Writing a custom binary implementation for day-to-day applications can take too much time and effort. With GeoArrow and GeoParquet, it can be done with a couple lines of code. Users can use Node.js and desktop rendering environments. This is continuing to push what can be done in the browser without any special graphics hardware.
A second Collaborator Summit will be held in September 2023 in New York City. You can register here to attend. Speakers will be announced in the coming months.
The Future of OpenVis
Corporate members have helped fund OpenVis progress. In particular, last year when the OpenJS Foundation partnered with the Urban Computing Foundation (UCF) to form the Open Visualization Collaboration Space, we welcomed four UCF members into the OpenJS Foundation: Foursquare, HERE Technologies, Joby Aviation, and Uber. Open visualization technologies are core to each of these companies’ leadership positions in the market, and they are energetically supporting the infrastructure and long-term growth of OpenVis. We wanted to extend a special thank you for their support and commitment this past year, and look forward to continued progress.
On the technology side, WebGPU has just come out in Google Chrome. It is the next-generation web API for accessing GPU resources. It’s a big departure from OpenGL that WebGL is built on. Right now, deck.gl and luma.gl are all on V8. V9 is scheduled to add WebGPU support to luma.gl and, therefore over time, deck.gl.
WebGPU changes the shader language that is being used and a lot of libraries will need to be updated all at the same time, so this process will take time.
With luma.gl, you will have a standardized interface for accessing either WebGL or WebGPU for rendering or GPU access. This is a good process. In the beginning deck.gl will continue to use the WebGL path that it already has, but over time that will change. We want a smooth transition from WebGL to WebGPU.
There is enthusiasm for WebGPU. Ultimately, OpenVis wants deck.gl to be a flagship WebGPU library. But it will require a lot of libraries to support WebGPU at the same time. Interleaved rendering between libraries takes lots of time and development effort.
Get Involved
We appreciate all of our contributors who have participated in the OpenVis Collab Space this year. We look forward to many years ahead!
Interested in getting involved? Join our bi-weekly community meetings to collaborate and learn all about OpenVis. Details on the OpenJS Foundation Public Calendar.
Shoutout to Chris Gervang for detailing these great milestones for OpenVis. You can watch his talk from OpenJS World 2023 on YouTube now.